Most IT professionals get introduced into their IT career with a help desk job. This role goes by many different titles and encompasses many different responsibilities, but it is generally the first person to provide user support for technical issues.
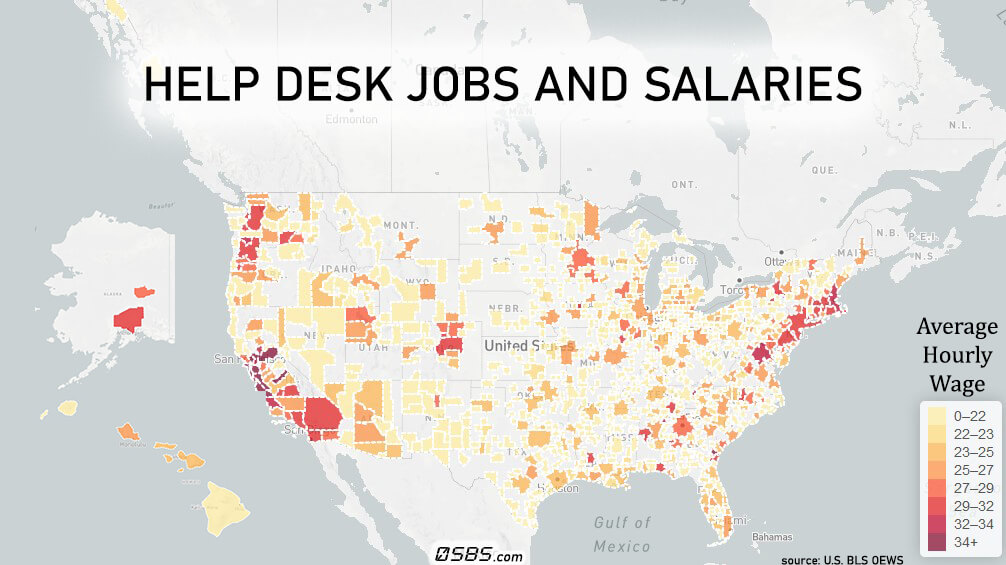
In this digital age, almost every company and government agency requires technical support for its employees to ensure they remain productive and operational in the event of a technical outage. Help desk technicians are in strong demand, and with this map we can visualize their employment and salary numbers.
The data for this map is provided by the U.S. BLS’s latest Occupational Employment and Wage Statistics survey for Computer User Support Specialists.
“Computer User Support Specialist” includes the following job titles:
- Help Desk Technician
- Help Desk Analyst
- Information Technology Specialist (IT Specialist)
- Support Specialist
- Technical Support Specialist
- Computer Specialist
- Computer Support Specialist
- Computer Technician
- Desktop Support Technician
Responsibilities usually include providing technical assistance to computer users, answering questions, resolving computer problems in person, via telephone, or electronically. They provide assistance concerning the use of computer hardware and software, including printing, installation, word processing, email, and operating systems.
Help Desk Salaries and Careers in the US
Cities with Most Help Desk Jobs
| AREA | STATE | TOTAL EMPLOYMENT |
| New York-Newark-Jersey City, NY-NJ-PA | New York | 38,220 |
| Dallas-Fort Worth-Arlington, TX | Texas | 23,040 |
| Los Angeles-Long Beach-Anaheim, CA | California | 22,970 |
| Washington-Arlington-Alexandria, DC-VA-MD-WV | Washington DC | 18,830 |
| Boston-Cambridge-Nashua, MA-NH | Massachusetts | 16,280 |
| Chicago-Naperville-Elgin, IL-IN-WI | Illinois | 16,130 |
| Atlanta-Sandy Springs-Roswell, GA | Georgia | 15,800 |
| San Francisco-Oakland-Hayward, CA | California | 15,640 |
| Phoenix-Mesa-Scottsdale, AZ | Arizona | 15,150 |
| Houston-The Woodlands-Sugar Land, TX | Texas | 13,050 |
Cities with Highest Salaries for Help Desk Jobs
| AREA | HOURLY WAGE | ANNUAL WAGE |
| Sacramento–Roseville–Arden-Arcade, CA | 41.51 | 86,350 |
| Napa, CA | 37.85 | 78,740 |
| San Francisco-Oakland-Hayward, CA | 37.82 | 78,670 |
| Madera, CA | 34.96 | 72,710 |
| San Jose-Sunnyvale-Santa Clara, CA | 34.93 | 72,660 |
| Carson City, NV | 34.61 | 71,990 |
| Salinas, CA | 34.54 | 71,830 |
| Vallejo-Fairfield, CA | 33.74 | 70,170 |
| Yuba City, CA | 33.28 | 69,210 |
| Boston-Cambridge-Nashua, MA-NH | 33.22 | 69,100 |
Highest density of Help Desk Jobs
| AREA | STATE | TOTAL EMPLOYMENT | JOBS PER 1,000 |
| Carson City, NV | Nevada | 550 | 18.944 |
| Sacramento–Roseville–Arden-Arcade, CA | California | 12,020 | 12.406 |
| Ann Arbor, MI | Michigan | 2,460 | 11.803 |
| Lansing-East Lansing, MI | Michigan | 2,160 | 10.962 |
| Ithaca, NY | New York | 500 | 10.805 |
| Boulder, CO | Colorado | 1,840 | 10.115 |
| Durham-Chapel Hill, NC | North Carolina | 2,930 | 9.471 |
| Austin-Round Rock, TX | Texas | 9,660 | 9.160 |
| San Jose-Sunnyvale-Santa Clara, CA | California | 10,030 | 9.097 |
| Provo-Orem, UT | Utah | 2,210 | 8.712 |
Field Descriptions
Name of Metropolitan Statistical Area and primary state(s).
ID – Unique identification number of Metropolitan Statistical Area
Total Employment – Estimated total employment of Computer and Mathematical Occupations, rounded to the nearest 10 and excluding self-employed.
Jobs per 1000 – The number of Computer and Mathematical jobs per 1,000 jobs in the given area.
Location Quotient – the ratio of an occupation’s share of employment in a given area to that occupation’s share of employment in the U.S. as a whole. For example, an occupation that makes up 10 percent of employment in a specific metropolitan area compared with 2 percent of U.S. employment would have a location quotient of 5 for the area in question.
Hourly mean – Mean hourly wage in dollars.
Hourly range – Hourly 10th percentile wage to hourly 90th percentile wage in dollars.
Hourly median – Hourly median wage (or the 50th percentile) in dollars.
Annual mean – Mean annual wage in dollars.
Annual range – Annual 10th percentile wage to annual 90th percentile wage in dollars.
Annual median – Annual median wage (or the 50th percentile) in dollars.
What this data includes
The wage data includes base rate wages, commissions, tips, hazard, and guaranteed pay for Metropolitan Statistical Areas.
It does not include overtime pay, holiday bonuses, stock bonuses, on-call pay, other forms of compensation, or data on rural areas. It also does not include data for non-help desk roles.
For a full explanation and notes on the data, please consult the OEWS FAQ.
Maps and data for other IT roles
A map for all computer and mathematical occupations in the US.
I am working on more maps that target other technical roles such as network and system administrators, software engineers, and information security analysts along with other tools to help IT professionals advance their career. Please bookmark or follow if you would like to read more.