ZERO SILLY BULLSH*T
JUST THE FACTS
ZERO SILLY BULLSH*T
JUST THE FACTS
To see windows environment variables type in set
%AllUsersProfile% – Open the All User’s Profile C:\ProgramData
%AppData% – Opens AppData folder C:\Users\{username}\AppData\Roaming
%CommonProgramFiles% – C:\Program Files\Common Files
%CommonProgramFiles(x86)% – C:\Program Files (x86)\Common Files
%HomeDrive% – Opens your home drive C:\
%LocalAppData% – Opens local AppData folder C:\Users\{username}\AppData\Local
%ProgramData% – C:\ProgramData
%ProgramFiles% – C:\Program Files or C:\Program Files (x86)
%ProgramFiles(x86)% – C:\Program Files (x86)
%Public% – C:\Users\Public
%SystemDrive% – C:
%SystemRoot% – Opens Windows folder C:\Windows
%Temp% – Opens temporary file Folder C:\Users\{Username}\AppData\Local\Temp
%UserProfile% – Opens your user’s profile C:\Users\{username}
%AppData%\Microsoft\Windows\Start Menu\Programs\Startup – Opens Windows 10 Startup location for program shortcuts
Win+R

The outlook for tech careers changes very often and it can be hard to understand the health of the tech labor economy.
Growing up in the late 90s, I was told it was silly to aspire to work in tech. The Dot-com bubble had just burst and unemployment for IT and computer professionals skyrocketed. Profits were sliced as investments were withdrawn and a looming fear undertook the tech industry. Would the markets ever recover?
10 years later in the early 2000s, IT and programming become the hottest skills. “Forget going to school to become a doctor or dentist, you can build video games in your underwear and earn the same salary!”
Fast forward another 10 years and coding boot camps are popping up to increase the supply of computer professionals, the industry is on fire. “Within 3 months you can earn $100k salaries and have ping pong tables at work!”
Read the news today… and you’ll be surprised to hear the same Fear Uncertainty and Doubt that permeated the late 90s. Fears of venture capital withdrawals, Uncertainty of the tech economy, and Doubt over the tech labor market.
To find the truth behind this, I took a look at tech market labor statistics from the US BLS. With data you can expose F.U.D. for what it really is.

After viewing the Best Tech Cities in the US – An Interactive Map, you may be wondering how these cities perform when they are compared to cost of living.
Many of the hottest tech salaries are in densely populated cities with skyrocketing costs of rent, transportation, utilities, and other living expenses that can diminish high incomes.
This map visualizes the areas of the US where tech salaries go the furthest. The results may shock you!

It’s hard to know your worth. When a potential employer asks you for your expected salary range, it’s very easy to stumble and spit out an arbitrary number, hoping that it matches the recruiter’s expectation.
There are different websites online that estimate salary expectations for tech professionals online, but many of them are inaccurate and limited to areas with the most submissions, usually software engineers in San Francisco or Seattle, but this isn’t inclusive to all tech workers. How do you know your worth if you’re a systems administrator working in a rural area of the United States?

Looking to start a software development career or already working the in the field?
These occupational statistics from the U.S. BLS provide the best insight into salaries and employment in your area. With these maps you can explore software engineering salaries and opportunities in your local area and understand salary expectations.

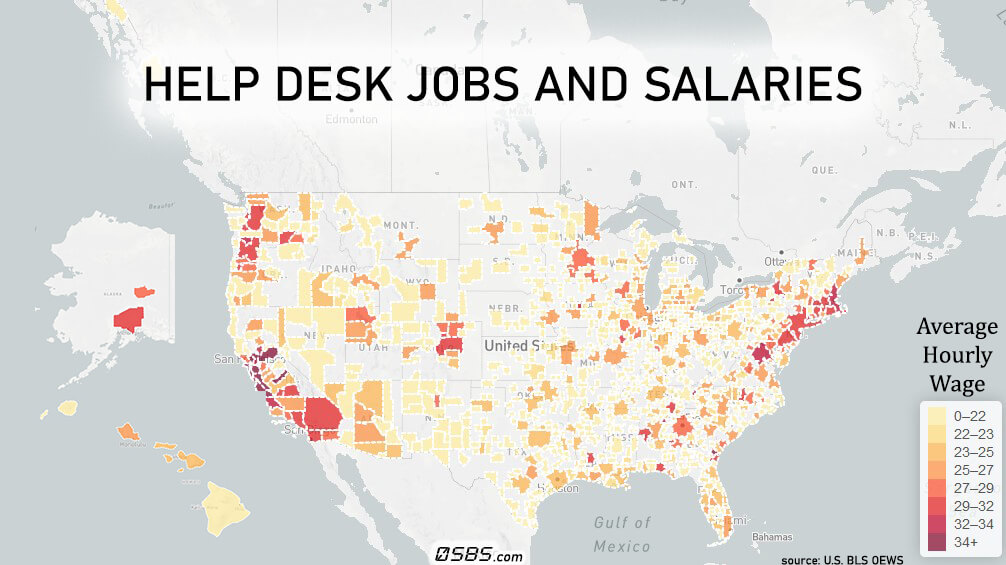
Most IT professionals get introduced into their IT career with a help desk job. This role goes by many different titles and encompasses many different responsibilities, but it is generally the first person to provide user support for technical issues.
In this digital age, almost every company and government agency requires technical support for its employees to ensure they remain productive and operational in the event of a technical outage. Help desk technicians are in strong demand, and with this map we can visualize their employment and salary numbers.

The U.S. Bureau of Labor Statistics surveys over 1 million establishments for 800 occupations in 580 areas of the United States and have made the data publicly available. The data set includes employment numbers, wages, and other details on the labor market. The results are staggering, the data is extremely large and difficult for readers to digest, until now.

Microsoft has released an advisory on a critical remote code execution and local privilege escalation vulnerability for Windows systems. The PrintNightmare vulnerability can allow attackers to gain full user rights and run malicious code, it is strongly recommended to update your systems.

The US Department of Defense has recently announced that the $10 billion Joint Enterprise Defense Infrastructure (JEDI) contract with Microsoft will be cancelled.